
When deploying your kdb+ estate, you may have struggled to efficiently and easily replicate your kdb+ instances around the globe or in the cloud. While there are many strategies that you can use, such as chained tickerplants or duplicating your feedhandler processes, all of them add complexity. In this post, I will introduce why you might want to replicate kdb+ instances, and explain how you can easily accomplish this natively with q and Solace PubSub+. Why replicate your kdb+ instances?
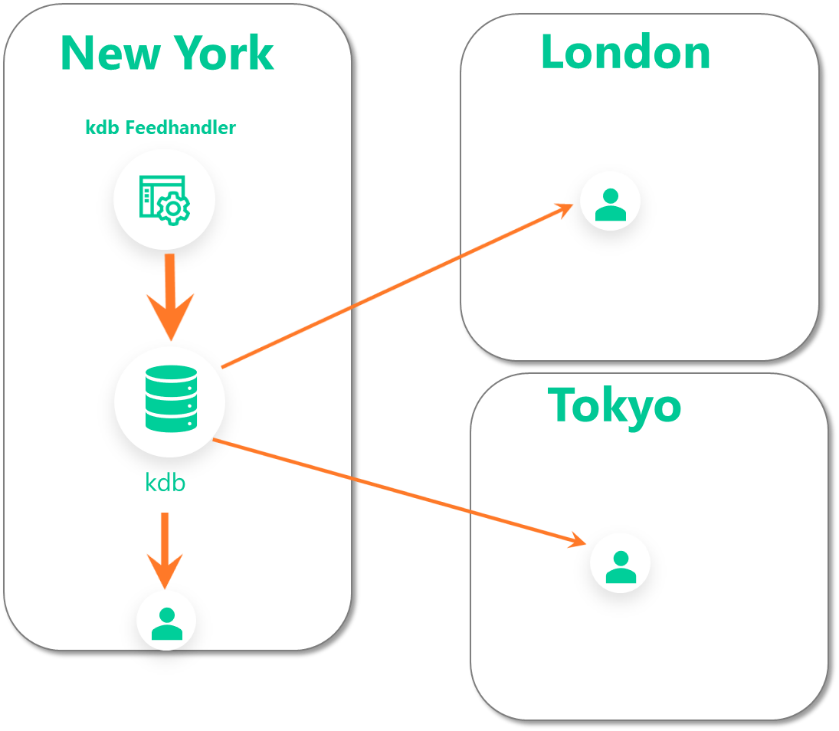
Your initial deployment of kdb+ applications may look something like this image, where you start out with your feedhandler pushing data into your kdb instance in New York and users across the globe are accessing the instance. As your user base grows, you may scale out your kdb+ instances horizontally, but you still incur latency costs as every query/response has to transit the WAN. So, as your user base grows, this architecture may not work as well. There are a few issues we would like to solve here by replicating your kdb+ instances across the globe:
Considerations for your kdb+ replication stackWhile there are various methodologies you may employ to achieve replication for your kdb+ instances, you would want to ensure the following:
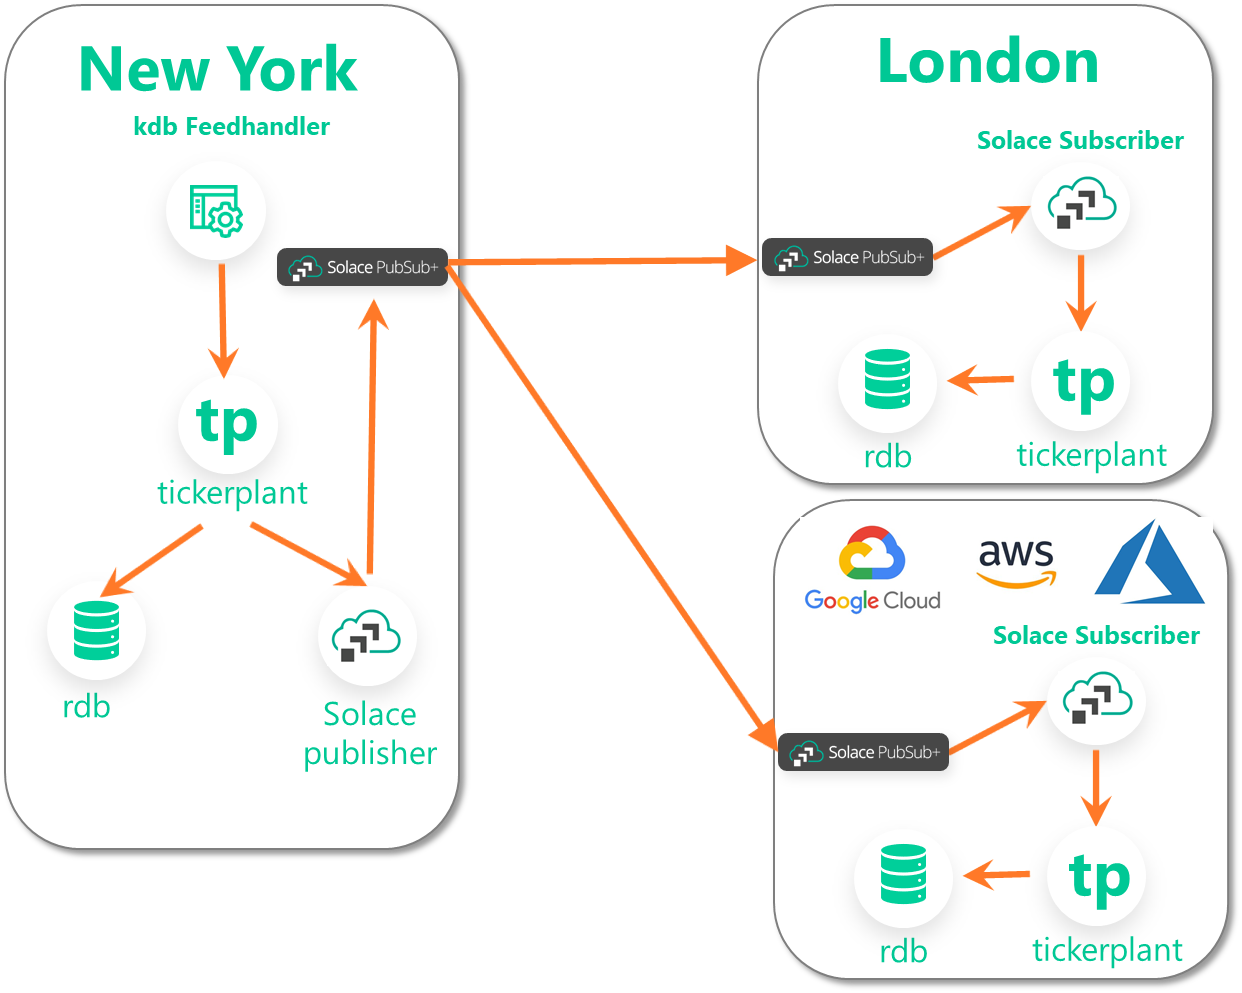
Replicating your kdb+ data with Solace PubSub+As discussed in the previous post, using the Kx Fusion Interface you can natively send messages to Solace PubSub+. Combining this capability with subscribing to your tickerplant, you can send updates to a Solace PubSub+ Event Broker in one region, have Solace PubSub+ forward the message to brokers in another region, and then push the updates into your tickerplant in the other region. The benefit of this pattern is that it can even be extended to the public cloud.
Creating an Event MeshCreating an event mesh – a cluster of brokers – sounds complicated but it’s actually extremely simple with Solace PubSub+. Follow these instructions in this video to link brokers together. A sample implementationConsider a single table quote with the following schema:
quote:([]time:`timestamp$();sym:`symbol$();bid:`float$();ask:`float$();bsize:`int$();asize:`int$()) Now to set up a process to subscribe from your tickerplant and publish onto Solace PubSub+, you could do something like this:
sendToSolace:{[t;d]
         if[not 98h=type d;:(::)];
         d:update `g#sym from d
         s:exec distinct sym from d;
         topics:{[t;s] "/" sv ("solace/kdb";string t;string s)}[t] each s;
         json:{[d;s] .j.j select from d where sym=s}[d] each s;
        .solace.sendDirect'[topics;json]
      }
upd:sendToSolace;
In a nutshell, the code above will retrieve the name of the table and the sym from the record, construct a well-defined topic (example: Now, in the other geography/location you will set up a Solace PubSub+ subscriber using something like the following code:
onmsg:{[dest;payload;dict]
 j:.j.k "c"$payload;
 h(".u.upd";`quote;(.z.P;exec `$sym from j;exec "f"$bid from j;exec "f"$ask from j;exec "i"$bsize from j;exec "i"$asize from j))
 }
.solace.setTopicMsgCallback`onmsg
.solace.subscribeTopic[`$"solace/kdb/quote/>";1b];
The code above will subscribe to all messages that start with the topic ConclusionUsing Solace PubSub+ with kdb+ gives you a low-touch and frictionless way to achieve a robust replication strategy for your kdb+ stack. The Solace PubSub+ Event Broker is also completely free to use as a docker container. You can find all code referenced above in the kdb-tick-solace repo. The post How to Replicate Your kdb+ Instances with Solace PubSub+ appeared first on Solace. How to Replicate Your kdb+ Instances with Solace PubSub+ published first on https://jiohow.tumblr.com/ via Tumblr How to Replicate Your kdb+ Instances with Solace PubSub+
0 Comments
No matter how clear the business benefits of robotic process automation (RPA) technology may be, the deployment approach--“How do we roll it out?”--may be a challenging new concept for many companies. While many organizations have a successful track record implementing enterprise technologies, an RPA project demands knowledge of existing processes and how employees perform their jobs. As a result, many companies may wonder what they should do to implement their first RPA program and how to communicate its benefits. Others may have achieved success with their RPA pilot but struggle when it comes to rolling it out to other departments in the organization. Such uncertainty is understandable, especially considering that this part of the RPA experience is relatively new. Yet one best practice has emerged. To successfully deploy the RPA program—and reap as many benefits as possible across the entire organization—companies need a well-defined RPA communications and advocacy plan consisting of three important touch points: Evangelizing RPA In Your Organization - Get Everyone On Board | UiPath published first on https://jiohow.tumblr.com/ via Tumblr Evangelizing RPA In Your Organization - Get Everyone On Board | UiPath 
When it comes to event broker monitoring, it’s clear that there is no one tool to rule them all. While some of our customers use PubSub+ Monitor to monitor their event brokers, others build their own using tools such as ITRS Geneos, AppDynamics and Prometheus, just to name a few. For those building your own solution, the 5 considerations I’ll describe below will ensure that your event broker monitoring covers all the bases and sets you up for operational peace of mind. To begin with, each monitoring tool will have its own method for collecting data from the systems and applications you wish to monitor. Then you create rules, alerts, and dashboards on top of that collected data. The examples in this post will be in the context of using ITRS Geneos, with the SolGeneos collector agent provided by Solace, but the ideas are transferrable to other monitoring tools. 1. Start Simple with Event Broker Status MonitoringThe first consideration is an easy one. The event broker itself has numerous status fields to inform on whether various aspects are enabled, running, and generally healthy. Leveraging what the event broker can report on through the SEMP protocol, your collection agent can query these fields and rules can be applied to give you a “green light” indicator. For customers using SolGeneos, there are comprehensive out-of-the-box data views available to report on, such as ‘HBA status monitoring’. An example is shown below of the event broker reporting on the status of each redundant fibre channel connection to the storage layer it relies on: 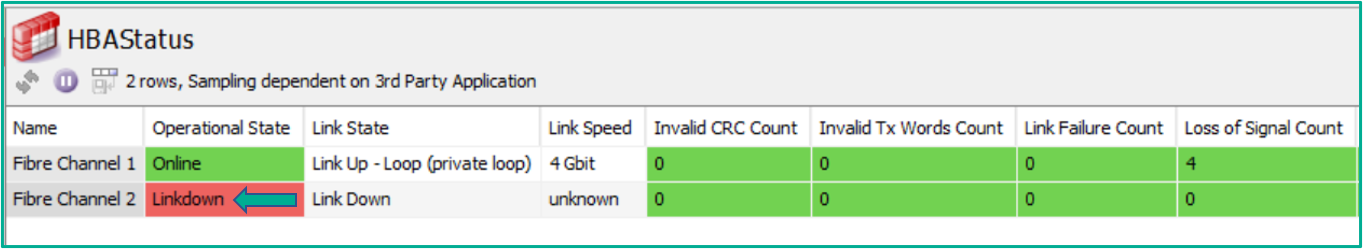
A data view showing one of the Fibre Channel links being in a ”Linkdown” state 2. Event Broker Activity Monitoring is Just as ImportantThis next consideration might not be an intuitive one — if an event broker is being used for its intended function, what is there to monitor activity-wise? There are two dimensions to this reasoning:
If a virtual broker’s message and byte rate for a particular application is tracked over a period of time, you’ll have a good idea of its steady state. While there can be gradual increases observed as usage grows, experience has taught me that sudden deviations from that profile indicates abnormal activity or misbehaving applications. Some examples are: component releases going awry, services getting stuck in a publishing loop, lossy subscribers triggering continual re-publishing, and so on. Putting activity monitoring in place keeps you from being left in the dark when it comes time to troubleshoot a volume-related incident after an outage. If you’re operating a multi-tenancy service, volume in one application may have caused an issue for another, unrelated application. As a service owner it is very beneficial to have a data-led conversation with application owners when you need to migrate a noisy tenant. Below is an example of a data view showing message and data rates on a per message VPN basis, as well as the aggregate view across the whole event broker: 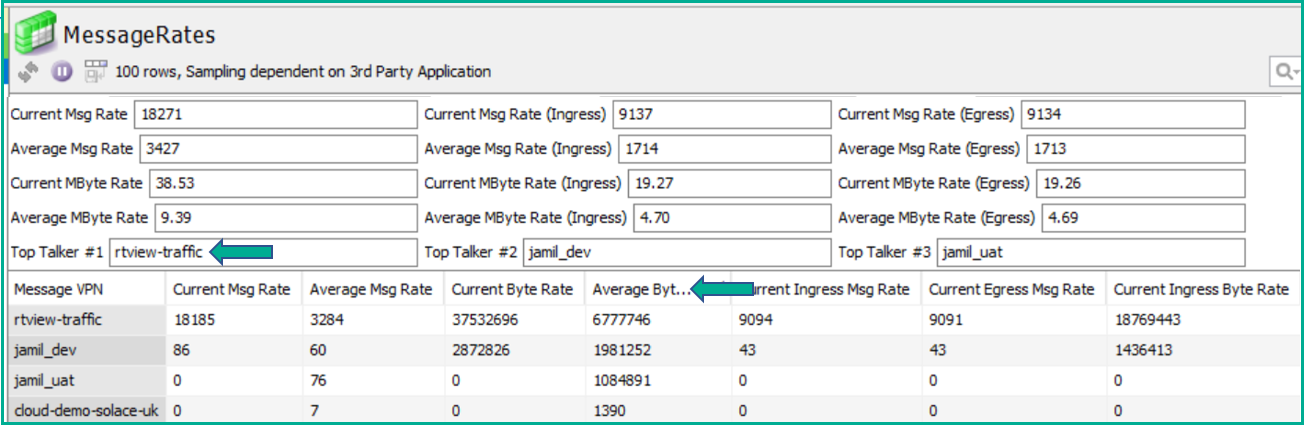
A data view showing metrics such as Average Byte Rate as well as the Top Talker VPN The view above has been generated by a custom addition to the SolGeneos extensible framework for collecting data through SEMP. The code is available open source in the SolaceLabs GitHub repo. When you’re collecting data on these rates, it is helpful to track the peaks in addition to currently observed rates. For example, if the data is being charted for a dashboard, the high-watermark can be the straight line on the graph alongside the currently observed rates. The example below shows the highest rate observed specifically for “Egress Message Rate” across the event broker, along with recording the top 3 VPNs by traffic generation at the time. There is an ‘all time high’ rate, as well as watermarks that reset on a daily, weekly, monthly, and yearly basis. 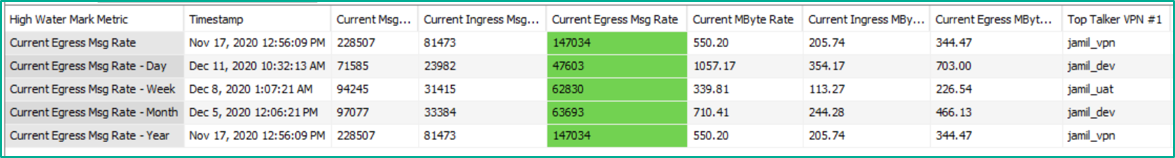
A data view with a search filter applied to show captured high water mark values for the Current Egress Message Rate metric These high watermark rates are also useful when it comes to capacity management to ensure the peak rates have enough headroom to grow with the current infrastructure. 3. Keep a Close Eye on Your CapacityAfter you have made sure the event broker is operating as expected and there is good ongoing activity of the service, your next concern is managing the various resource limits and proactively monitoring for high utilization. There are two dimensions to consider here:
Once again, the SEMP protocol makes it easy to query for each resource’s current usage and max limits, and create a monitoring view like this: 
A data view showing each message VPN limit as well as its current usage value The format of “Current” vs. “Max” for each metric makes it easy to construct general purpose rules too. The rule can access both values to calculate a percentage and dynamically alert/trigger across the different resource types and max limit values. For the second dimension of ensuring the event broker limits are not being exceeded by the cumulative allocations at each message VPN, you can create a view like this: 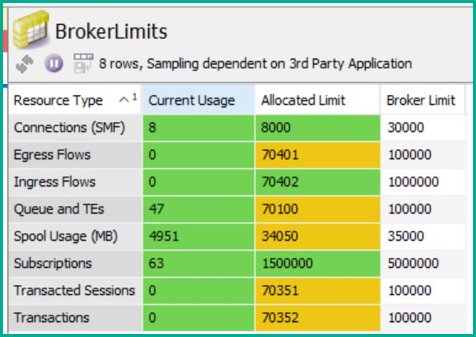
A data view showing the broker-wide limits, current usage and current allocation. Another way of considering this particular message VPN limits allocation point is this: if all airline passengers show up for a flight, were there more seats sold than the available capacity of the aircraft? 4. Make Alerts Meaningful and ActionableSending alerts from the monitoring tool is a key aspect of the whole solution, because whether you’re generating an email, triggering the creation of a ticket, or posting to a chat channel, the alert is an interruption by design. Having served in an operational role where alerts woke me in the middle of the night, I can attest to the fact that everybody involved will appreciate it if you make alerts as informative and actionable as possible. Take, for example, an alert just telling you that a message queue is filling up. The workflow could be to receive the alert, log into your administration tooling to gather more information and context to the alert, and then eventually take some action. How much more useful would it be for the alert to contain the information you’d need to triage the situation without logging into your administration tool? If a queue is filling up, questions you might want to answer could be:
Below is an example of an ‘enhanced’ queue alert that was sent to a Slack channel. Note the extra information that helps with triage, like the fact that the queue’s high watermark level is the same as the current backlog level, which tells you this is an unprecedented situation for this application and queue. 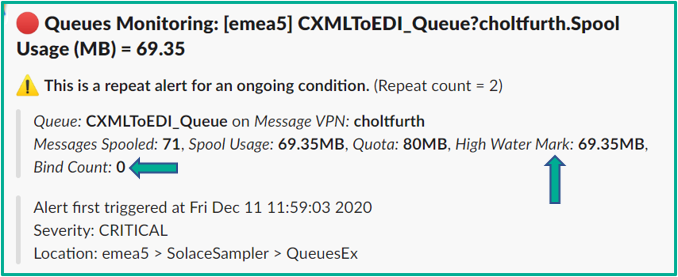
An example alert for queue usage being high, enhanced with additional information such as high-watermark level and bind count Some of the logic behind triaging an alert could also be baked into rule logic, so recipients can determine the severity of the situation based on other pieces of data already factored in. The summary here is that the data collection agent needs to be comprehensive enough to capture and supply as much information as possible to drive this kind of triage, whether it is automated within the rule logic or done manually upon receipt of the alert. A custom SolGeneos monitor for displaying a rich set of queue information is also included in the GitHub repository mentioned earlier. 5. Consider Synthetic Monitoring for a Holistic ApproachLast but not least, my favorite recommendation. Relying on metrics and other collected data only goes so far to provide peace of mind for the health of the event broker as a service. For most deployments, there is a lot of other supporting infrastructure involved. At the very least you may have a DNS alias for your event broker’s connection URI, so the DNS service and the entries within it need to be correct and responding. You may also be fronting your event brokers with a load balancer, so that needs to be responding well and routing the traffic appropriately. Synthetic monitoring is the idea of testing a service by actually trying to use it for its purpose. Loading a website to validate that your webserver is working is one such example of synthetic monitoring. To that end, the code for a ‘Messaging Tester’ monitor has been made available in the GitHub repository where the monitoring data pushed by the SolGeneos agent is actually the result of performing a message send and receive test to a topic and queue destination. The ‘Message Tester’ monitor produces a view like this when the tests pass as successful, and will provide detailed information about the cause of failures when they don’t: 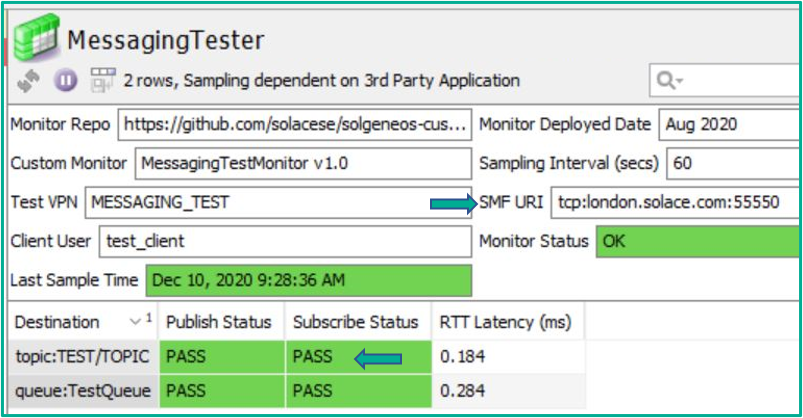
A dataview showing a successful publish and subscribe test against the broker at URI: london.solace.com As a side effect of the published test messages also being subscribed to by the same process, it allows for round-trip latency to be calculated too. It should be stressed that this latency number will certainly not be the lowest latency messaging that can be achieved by the event broker; this is because the monitoring host, nor the process, would have been tuned for low-latency. However, the number you get is still a good indicator of some baseline performance that can be achieved by the monitor acting like a real messaging client. Monitoring how that baseline latency number changes between test samples can be informative in an operational sense too. Furthermore, logging the value to a time-series database can provide a view of this changing over time. Synthetic monitoring like this does not only validate that messaging is working end-to-end, but it can also validate that performance is within an expected tolerance and that issues like network congestion or packet loss are not impacting the experience of messaging clients connected to the event broker. ConclusionI hope these 5 recommendations give you peace of mind that if the monitoring dashboard is green, the service is healthy. Please review the GitHub repository for more detail around the open-source monitor samples. The post 5 Considerations for Building Advanced Monitoring for Your Event Broker appeared first on Solace. 5 Considerations for Building Advanced Monitoring for Your Event Broker published first on https://jiohow.tumblr.com/ via Tumblr 5 Considerations for Building Advanced Monitoring for Your Event Broker No matter how clear the business benefits of robotic process automation (RPA) technology may be, the deployment approach--“How do we roll it out?”--may be a challenging new concept for many companies. While many organizations have a successful track record implementing enterprise technologies, an RPA project demands knowledge of existing processes and how employees perform their jobs. As a result, many companies may wonder what they should do to implement their first RPA program and how to communicate its benefits. Others may have achieved success with their RPA pilot but struggle when it comes to rolling it out to other departments in the organization. Such uncertainty is understandable, especially considering that this part of the RPA experience is relatively new. Yet one best practice has emerged. To successfully deploy the RPA program—and reap as many benefits as possible across the entire organization—companies need a well-defined RPA communications and advocacy plan consisting of three important touch points: Evangelizing RPA In Your Organization - Get Everyone On Board | UiPath published first on https://jiohow.tumblr.com/ via Tumblr Evangelizing RPA In Your Organization - Get Everyone On Board | UiPath High reliability and availability require the right tools and a commitment to maintenance. For more than fifty years, Intel customers have looked to us to deliver the highest levels of product quality. This commitment to quality has been key to our success and is more important than ever in the increasingly complex modern era of …continue reading Managing Platforms in the Modern Era The post Managing Platforms in the Modern Era appeared first on IT Peer Network. Managing Platforms in the Modern Era published first on https://jiohow.tumblr.com/ via Tumblr Managing Platforms in the Modern Era Over the years, I’ve spotted it sitting on office desks around the world. You probably have, too: the little toy bobbing bird. It dips down to take a sip of water, bobs upright, rocks back and forth, then dips down to take another sip. If you set it up right, it will do this again and again, repeating the same task. Day in, day out. It always made me smile, until the day I noticed that many of the people in those offices were doing the exact same thing. Stuck performing the same repetitive work tasks over and over. Day in, day out. Then I didn’t find it so cute. In business, we all want the same thing for ourselves and our coworkers: the freedom to take on new challenges, be creative, collaborate, innovate, and achieve more than we thought possible, not to feel like we’re stuck in a repetitive loop. What a Simple Office Toy Taught Me about Humans | UiPath published first on https://jiohow.tumblr.com/ via Tumblr What a Simple Office Toy Taught Me about Humans | UiPath Having joined UiPath in the first half of 2017, I consider myself fortunate to have experienced it for a short while as a scale-up company with a startup mindset, but also to have been part of the exciting journey of it becoming the global organization it is today. It was probably during the first all hands meeting I attended that I heard UiPath Co-Founder and CEO Daniel Dines mentioning customer centricity as one of the core tenets of the company. “Guys, the customer knows better and is smarter than us,” he was pointing out. More than three years down the line, we believe this made all the difference for the company. More on this a bit later on. There is a common sentiment for everyone in UiPath to keep honoring our roots and giving back. And it’s the very thing that birthed an exciting initiative, the UiPath Automation Awards CEE (Central and Eastern Europe) & Turkey. The competition was pioneered last year by our Chief Strategy Officer (CSO) Vargha Moayed. In his own words: 2020 Automation Award Winners & Advice For Emerging Tech | UiPath published first on https://jiohow.tumblr.com/ via Tumblr 2020 Automation Award Winners & Advice For Emerging Tech | UiPath We’re witnessing the rise of a new type of company: the fully automated enterprise™. Fully automated enterprises have the potential to revolutionize how business is done and, in their wake, leave entire industries transformed. Our customers are excited about the potential of full enterprise automation but curious about the path. We listened. Above all, our customers wanted an example, a model of a fully automated enterprise they could take back to their company and say, “This! This is what I want!” In my previous article, I explained what a fully automated enterprise was and why your company should become one. I also described the four pillars your company could use to transform into a fully automated enterprise. Now, I’ll walk you through what a fully automated enterprise really looks like using a fictitious company based on a real use case. The Fully Automated Enterprise Is Here (And Looks Like This) | UiPath published first on https://jiohow.tumblr.com/ via Tumblr The Fully Automated Enterprise Is Here (And Looks Like This) | UiPath I’m lucky to have a front-row seat to some of the highest-level automation discussions in our customers’ board rooms. The more I speak with customers, the more I hear a recurring question: “What vision should we be working towards for our automation initiatives?” Well, we’ve been working on an answer. What we’re pursuing here is a realization of what it means for a business to operate in a world enabled by automation. What it means for companies to reach an optimal amount of automation. What we’re chasing is the fully automated enterprise™. The fully automated enterprise is the ultimate form of all the concepts our customers have been working toward. What is a Fully Automated Enterprise? The 4 Pillars & Benefits | UiPath published first on https://jiohow.tumblr.com/ via Tumblr What is a Fully Automated Enterprise? The 4 Pillars & Benefits | UiPath Over the years, I’ve spotted it sitting on office desks around the world. You probably have, too: the little toy bobbing bird. It dips down to take a sip of water, bobs upright, rocks back and forth, then dips down to take another sip. If you set it up right, it will do this again and again, repeating the same task. Day in, day out. It always made me smile, until the day I noticed that many of the people in those offices were doing the exact same thing. Stuck performing the same repetitive work tasks over and over. Day in, day out. Then I didn’t find it so cute. In business, we all want the same thing for ourselves and our coworkers: the freedom to take on new challenges, be creative, collaborate, innovate, and achieve more than we thought possible, not to feel like we’re stuck in a repetitive loop. What a Simple Office Toy Taught Me about Humans | UiPath published first on https://jiohow.tumblr.com/ via Tumblr What a Simple Office Toy Taught Me about Humans | UiPath |
About UsNetmetic site features more about newly released products in the market and their service providers. Bookmark this site & read our blogs regularly for free business tips, review on new release products in the market and high quality service providers for your products. |
||||||||||||||
 RSS Feed
